In fact, most people will come to this step to do Normal Capability Analysis without checking the statistical assumptions ( stability and Normality )
Most will use Microsoft Excel worksheet to calculate Cp & Cpk but seldom will calculate Pp & Ppk due to limitation of data collection.
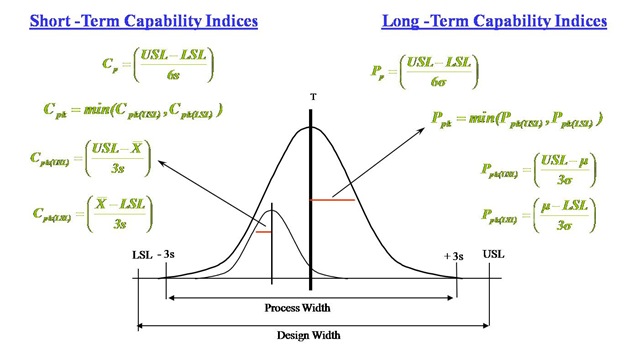
The formula for Cp, Cpk, Pp & Ppk are as below :
In Minitab, Cp, Cpk, Pp & Ppk can be calculated easily.
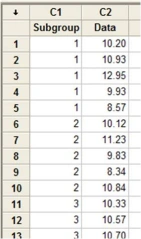
E.g. Sample data is collected as follows :
Using Minitab software, arrange above as data structure as shown on Minitab worksheet below
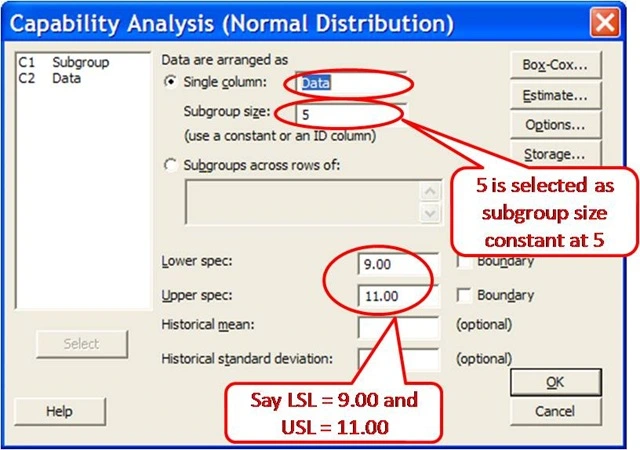
Then, go to Stat>Quality Tools>Capability Analysis>Normal to run the analysis
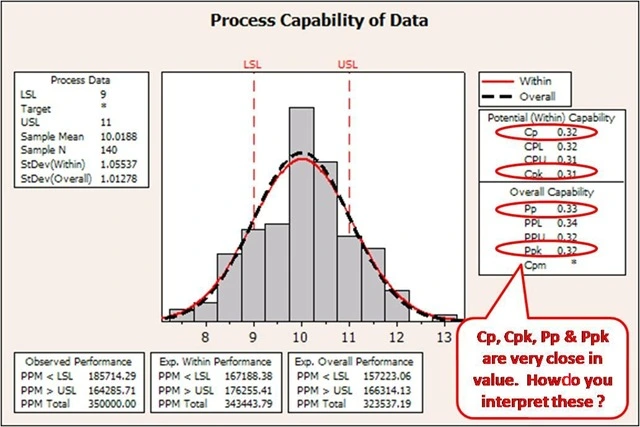
The results of Capability Analysis as follows :
What’s your take on that ?


Can you do Ppk with 6 parts and is it required for every dimension?
Hi,
Sorry for such long delay in response to your question.
Ppk is used to report capability in long term. Thus, the word “performance” was used for this purpose.
My view is you still can do Ppk for only 6 parts (6 data value that represent performance) BUT it will only meaningful if the 6 parts represent long term process and statistically in control.
Hope above comments help.
Regards,
LKY